Findings
For the sake of time, space, and interest this paper only includes a summary of some of the pertinent findings amongst the data. A full report and analysis is available upon request1.
Establishing context – Individual Perspectives
Two sections of the 2007 Facebook Project survey applied specifically to gauging campus climate as it relates to race. The first included a simple series of paired questions relating to safety in the general college atmosphere. Respondents were asked the following questions:
- Do you believe UIllinois Facebook is a friendly or hostile environment for minorities?
- Do you believe the University of Illinois campus in general is a friendly or hostile environment for minorities?
- Do you believe Facebook is a friendly or hostile environment for Native Americans (Indigenous Americans)?
- Do you believe the University of Illinois campus in general is a friendly or hostile environment for Native Americans (Indigenous Americans)?
Answer choices were given on a spectrum going from very friendly, somewhat friendly, not friendly but not hostile, somewhat hostile and not at all hostile. As it turns out most respondents in general felt both the campus and Facebook were somewhat friendly for minorities (median and mean around 4 with 5 being very friendly) places to be. When filtered to just pro-chief respondents the mean response favoring a friendly view of campus went up, but not to a significant degree. When only anti-chief respondents were selected the mean average dropped almost a full point bringing the average opinion to be somewhere between somewhat friendly and not friendly but not hostile. The true contrast comes when examining perceptions of feelings of hostility towards Native Americans. Pro-chief respondents scored about the same as they did in regards to atmosphere for minorities in general, whereas anti-chief participants felt Facebook was somewhere between not friendly but not hostile and somewhat hostile and campus in general was actually somewhat hostile. The survey did not receive any responses who identified as Native American and very few racial minorities (about 11%), which were almost all Black or Latino/a. So on the whole most Facebook users thought it wasn’t a hostile environment for minorities, but anti-chief users did believe it was potentially hostile to Native Americans. What’s perhaps interesting here is that despite the threats and powerful exchange of feelings on Facebook most survey recipients thought the face to face world was a more potentially hostile place of exchange.
Personal Actions
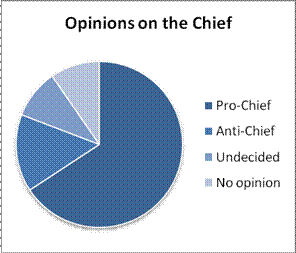
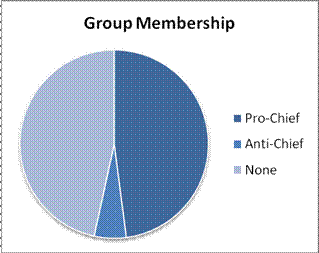
A later section on the survey then inquired into user actions in response to the Chief issue. They were asked about their overall stance on the issue, group membership, and if they took part in the picture-change resistance. The results were a bit staggering, as nearly two thirds (48, 65.8%) of respondents identified as pro-chief. A mere 11 (15.1%) professed anti-chief views and the remaining 14 (9.6% each) were split evenly between undecided and no opinion. Of the 73 active members examined only 4 (5.5%) belonged to anti-Chief groups and 37 (50.7%) professed membership in pro-Chief groups. Active protest was less common, however, as only 13 (17.8%) changed their picture to one of the Chief to protest the removal and 3 (4.1%) put up a ‘Racial stereotypes dehumanize’ icon in response. No respondents took part in any of the joke/fictitious pictorial reactions such as ‘Suppor the chef’ or ‘Shoop Da Whoop.’ As figure 1.1 dramatically displays the proportions below, based on this data we can surmise Facebook is utterly dominated by pro-chief sentiments and pro-chief users. This confirms the previously assumed notion that Facebook is reflective of face to face world pro-chief views.


back to study design and methodology | forward to group behaviors