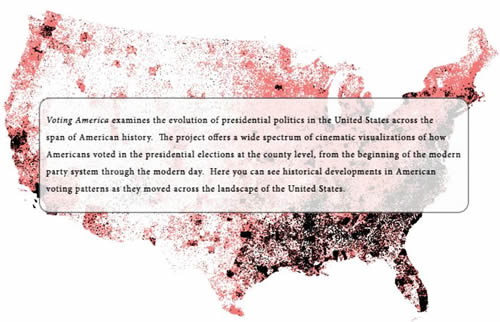
Tomorrow is election day. To celebrate, I want to highlight the University of Richmond (“Go Spiders!”:http://richmondspiders.cstv.com/) and their “Digital Scholarship Lab”:http://digitalscholarship.richmond.edu/ who have a very cool online exhibition of electoral statistical maps on “their website”:http://americanpast.richmond.edu/voting/index.html. (warning: auto-playing video)

Personally, I love seeing data presented in new ways. As a history major and a bit of a cartographic nerd, these time-lapse maps represent the ultimate in teaching tools. Things I’ve learned by putzing around this site:
* “The populist party had a surprisingly heterogeneous geographic appeal.”:http://americanpast.richmond.edu/voting/thirdparty.html
* “African-American populations haven’t really left the south — and there’s still a lot of empty space out there.”:http://americanpast.richmond.edu/voting/aawpopulation.html
* “Looking at the 2000 election results by county makes me wonder how it could’ve been so close.”:http://americanpast.richmond.edu/voting/aawpopulation.html
Psyched to make your voice heard? Find out where you need to go to “cast your vote”:http://maps.google.com/maps/mpl?moduleurl=http://maps.google.com/mapfiles/mapplets/elections/2008/us-voter-info/us-voter-info.xml tomorrow using Google Maps.
Duenos.net
A blog about interestingness
